
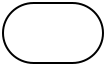
Start / End
Also: terminator, terminal, oval
Where the process begins and ends. Label it "Start", "End", or the event that starts it, such as "Order received".
Most flowcharts need only five symbols: an oval to start and end, a rectangle for each step, a diamond for each question, a parallelogram for input and output, and arrows to connect them. The rest exist for special cases, mostly from the days of punched cards and tape.
The shapes are standardized in ISO 5807 (and the older ANSI X3.5), so a diamond means a decision in every tool and textbook.
Free. In draw.io, open the library with File › Open Library from › Device. Each symbol below also downloads as SVG, or copies straight into draw.io.
These cover nearly every business process, algorithm or school assignment.
Where the process begins and ends. Label it "Start", "End", or the event that starts it, such as "Order received".
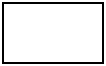
One step: "Send invoice", "Check stock". Start the label with a verb.
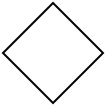
A question with two or more answers, usually yes and no. Label every arrow that leaves it with its answer.
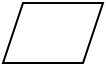
Data going in or out: a customer fills in a form, the system prints a receipt.

Shows the order of the steps. Flow normally runs top to bottom or left to right.
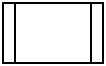
A step explained in detail elsewhere, such as in its own flowchart. The double side lines mark it.
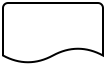
A step that produces or uses a document: a report, an invoice, a contract.

Several documents, such as a batch of invoices.
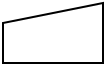
Someone types data in: a PIN, a search, a form field. The slanted top looks like a keyboard.
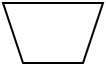
A step done by a person, not by a machine or system: "Sign the form", "Pack the box".
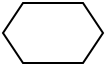
A setup step before the main work, such as setting a counter to 0 before a loop.
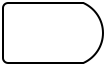
Waiting: "Wait 24 hours", "Wait for approval".

Data saved to or read from a database or disk.
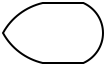
Information shown on a screen to a user.

A small circle with a letter. The flow jumps to the circle with the same letter, instead of drawing a long arrow across the page.

The flow continues on another page. Write the page number and a letter inside.
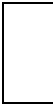
A note that explains a step, attached with a dashed line.
You will meet these in older textbooks and data-processing charts. Most modern flowcharts get by without them.
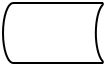
Data stored somewhere, without saying where.

Data held in memory while a program runs.
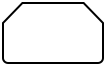
Marks the start and end of a loop. The two shapes share a label, such as "Each order".
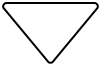
Several sets of items combined into one.
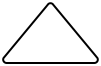
Taking part of a set out, for example pulling the overdue invoices from a list.

Putting items in order.

Arranging items into a set order or format.

Several flows join, and all of them must arrive before the process goes on (logical AND).

Several flows join, and any one of them is enough to go on (logical OR).
One start, at the top. Flow goes down or to the right; arrows that go back up are loops, so keep them few.
One action per box, starting with a verb. If a box needs two lines of text, it is probably two steps.
Every decision has a labelled arrow for each answer. A diamond with an unlabelled arrow is the most common mistake.
If the chart no longer fits on a page, move a part into its own chart and show it as a predefined process.
Take a photo. Sketch2scheme turns it into a clean, editable flowchart with these shapes, ready for draw.io, PNG or SVG.
The oval (start and end), the rectangle (a step), the diamond (a decision), the parallelogram (input or output) and the arrow. With these five you can draw almost any process.
A decision: a question such as "Is the payment approved?". Each arrow leaving the diamond is one answer and should be labelled, usually Yes and No.
A process is one step shown in full. A predefined process (the box with double side lines) stands for a whole set of steps described in another flowchart.
Yes: ISO 5807, and the older ANSI X3.5. Most drawing tools, draw.io included, follow them.
Symbols are drawn with draw.io (diagrams.net), which is open source. Use them freely in your own drawings, documents and lessons.